Loading public and own data
Choose a source
Open the dataset picker above the plot, or the Data Management page.
- Bundled demo — a small OneStop sample, for learning the app.
- Synthetic sample — a hand-made six-word trial.
- Public corpus — OneStop or PoTeC, downloaded when you ask, on your own computer only (see OneStop).
- + → Import files — your own tables.
- + → Create manually — type a text and place fixations on it by hand: click to add, drag to move, or edit the table.
What your data needs
| Table | Minimum |
|---|---|
| Words (interest areas) — e.g. EyeLink's Interest Area Report | trial ID, word ID, and the word box (the word text, to show it) |
| Fixations — e.g. EyeLink's Fixation Report | trial ID, duration, and x/y or a word ID |
Either table alone also works. Participant and text IDs, timestamps, raw gaze, conditions and reading measures are optional and unlock more features.
Files can be CSV, TSV, TXT, Parquet, Feather, Excel, or a .zip of any of
these. A .zip holding both EyeLink reports (one folder per participant, say)
can go in both rows: each row reads only its own reports and says which it
left out. See Data format for every field.
Import files
The import screen has three parts:
- Name & description — the description is optional.
- Upload data tables — upload Fixations, Words (interest areas) and, optionally,
raw gaze. The app
guesses which column is which; check its guesses. The trial count under each
ID picker is a quick sanity check, and hovering the
icon beside a mapped field shows its first few values and how they are read,
for example
0.12 → 120 msfor a column in seconds. On a guess you have not confirmed yet, the same values are on the confirm button's tooltip. If trial order was randomized, map your item column as Text ID:TRIAL_INDEXonly orders a participant's trials. Reading measures from an EyeLink interest-area report (IA_DWELL_TIME, …) are picked up automatically, and are what Corpus Analysis shows. Optional tables, one row per participant, trial or text, add fields to filter and group by. - Recording setup — the screen the data was recorded on (below).
Then click Add dataset. Anything the app cannot use is listed above the button before you confirm.
To see what the two main tables look like, click Download example tables before uploading anything: a tiny Words table and fixation table that map without a single manual pick, with a README giving each column's unit and what the IDs mean.
Recording setup
Describe the screen the data was recorded on, not the one you are using now. A wrong resolution rescales every figure, so nothing is preselected. For each value, say how you know it: measured, estimated from your data, or a default. That answer travels with the dataset, so others can tell measured values from assumed ones.
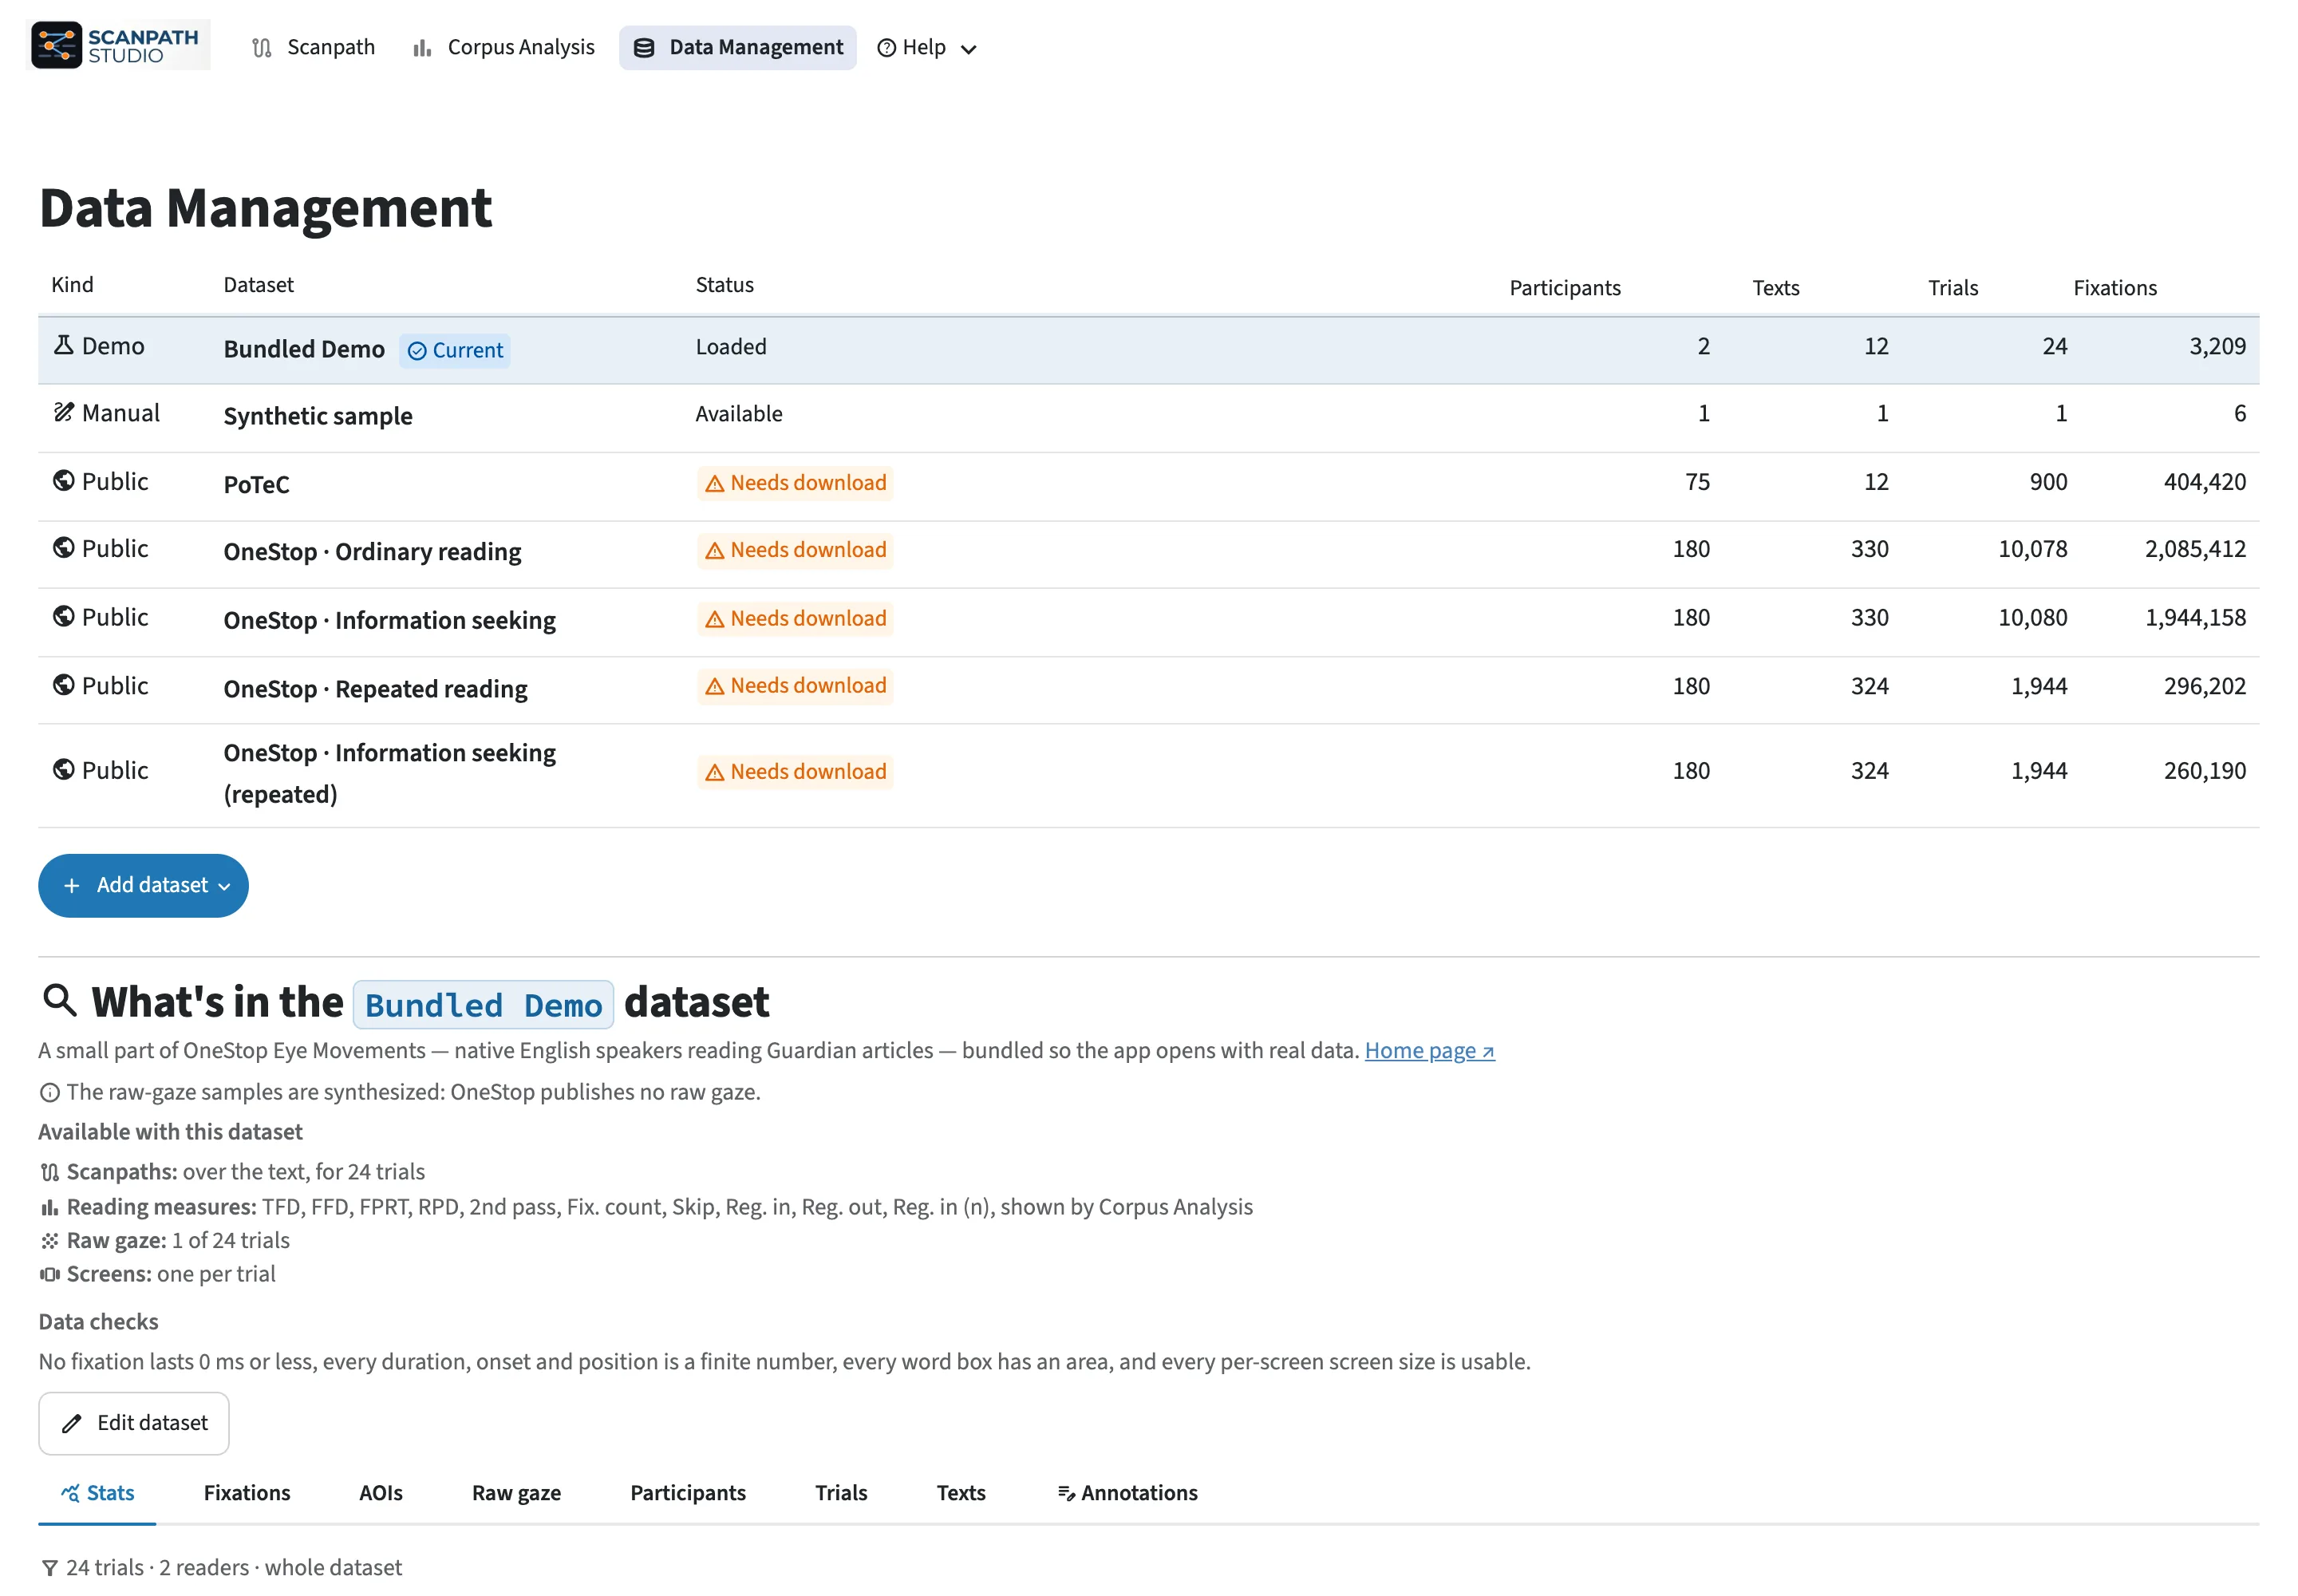
The Data Management page
Data Management lists every dataset with its counts; click a row to open it. Edit dataset opens under the list, below the open dataset's counts and tables, and changes its name, description, column mapping, recording setup and metadata tables, or adds a table it is missing (Fixations, Words (interest areas) or raw gaze); its mapped fields show the same value preview. On an added dataset, changing an ID or coordinate column shows a few values as they are now and as they will be after saving, and Count trials and check joins says whether trials would merge or the word boxes or a metadata table would stop matching. Its Download setup file writes the mapping in your files' own column names, so whoever has the same files can restore it on the add screen; anything a restore cannot redo by itself is listed beside the button. For the demo and the public corpora, a recording setup you save is your own for that dataset alone: the setup the corpus declares is kept, and Reset to source setup goes back to it. Nothing applies until you click Save changes; Cancel discards all of it. The page also holds each dataset's tables and its annotations, and at the foot, what is saved on this computer.
Above the open dataset's tables, Data checks looks for values that loaded
as numbers but cannot be right: fixations lasting 0 ms or less or with an
infinite duration or onset, fixations or raw-gaze samples whose position is
missing or infinite, word boxes with no width or height or at infinity, and
per-screen screen sizes that are infinite or 0 or less. Each finding gives the rows and trials affected, the columns
they came from, a few example rows, and what the app does with them. Nothing
is removed: the rows stay in every table and export. check_data_health runs
the same checks from Python, and scanpath-studio check from the terminal.
Columns keep the names they have in your files, so a column uploaded as
CURRENT_FIX_DURATION is called that in the tables. On chips, filters and
plot controls, a mapped field is named by its role (Participant, Duration
(ms)), with your column's name in its tooltip. A column marked (computed) is
one Scanpath Studio derived, such as a saccade's amplitude.