Scanpath visualization
The Scanpath view draws one reading on the screen it was recorded on.
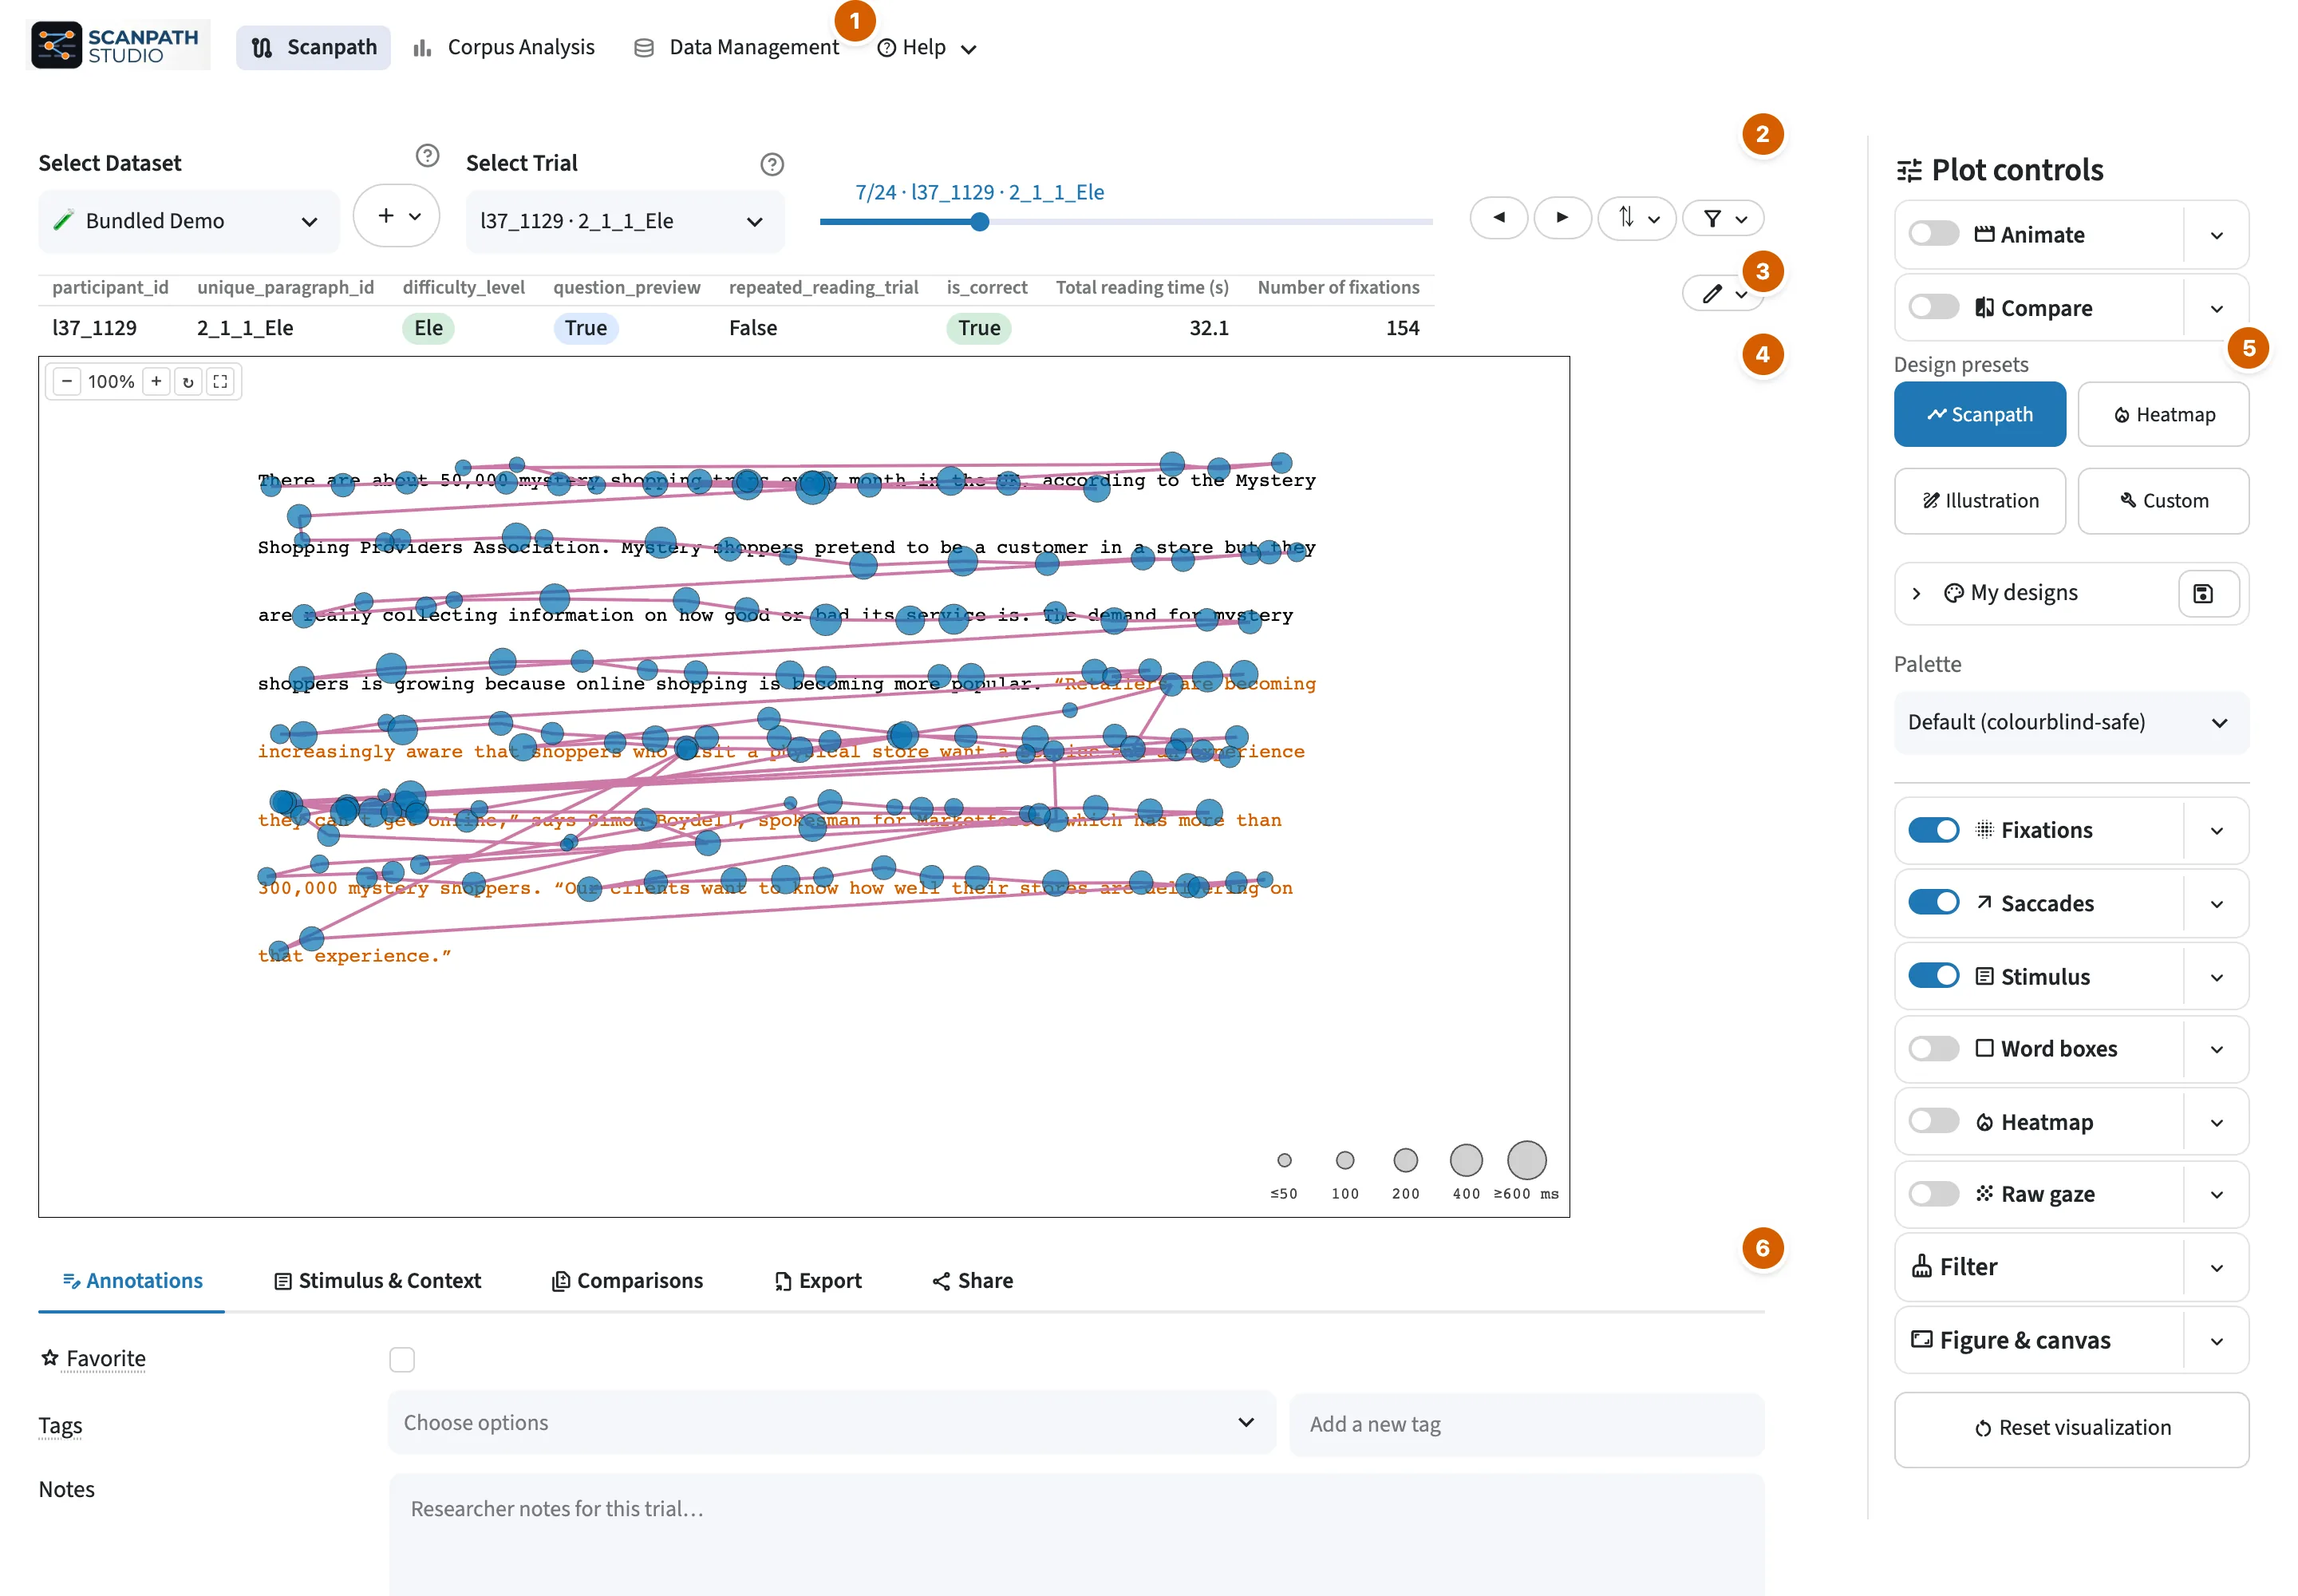
- Views and Help.
- Dataset and trial pickers, sort (⇅) and filter funnel.
- The trial's summary.
- The figure.
- Plot controls.
- Annotations, Stimulus & context, Comparisons, Export and Share.
Choose a trial
Pick a trial above the plot. The filter funnel beside it narrows the list by text, participant, condition or annotation, and ⇅ sorts it. A trial with several screens gets a second navigator to move between them.
Control the layers
The Plot controls rail starts with Animate, Compare, four design presets and a palette. Below them, each section is one line: a switch, and a ▾ with its settings.
| Section | What it controls |
|---|---|
| Fixations | markers: size, color, order |
| Saccades | lines and arrows, colored by direction or reading type |
| Stimulus | text, span highlight, stimulus image, font and background |
| Word boxes | each word's interest area: outline color and opacity; fill color and opacity |
| Heatmap | where fixations concentrate, by count or duration |
| Raw gaze | the gaze samples as recorded |
| Filters & highlights | which fixations and saccades are drawn |
| Figure & canvas | screen framing, axes and grid, title and labels, hover fields, legends |
Color ranges start on Auto, scaled to each trial. Pin a range to keep it fixed as you step through trials and filters, so they stay comparable; its number boxes take any endpoint, beyond the data shown too. The word-box heatmap's range is in dwell time per word (ms), the summed duration of the fixations in each box, or in fixations per word; on Auto it runs from 0 to the trial's highest. Interpolated blurs the fixations with a Gaussian (its Blur row: Auto, or a σ in px) and scales to each figure's own peak, so its range is grayed. The range still applies to Word boxes, and in Compare, which always draws word boxes.
Marker size shows fixation duration on a fixed scale: 50–600 ms span the smallest to the largest marker in every trial, both sides of a comparison, the replay and every export, so one duration is always one size. Shorter fixations take the smallest marker and longer ones the largest. Under Fixations ▾, Scale picks the curve: √ duration (the default) grows marker area with duration, Linear grows the diameter with it, Log compresses long fixations. Durations sets the two bounds, and Size key draws reference circles labeled in ms in the figure's corner (in Compare, only while both scanpaths use the same marker size range). Relative to this figure stretches each figure from its own shortest to longest fixation instead, so its sizes compare only within that figure. Share links, settings files, saved designs and restored sessions from before the fixed scale reopen on the relative one, as they were drawn.
Filters & highlights
Filters & highlights thins the trial on screen (the funnel above the plot chooses
which trials you can pick). For fixations, Highlight or Discard
short, long, out-of-bounds or blink fixations, or show only an index range.
Out of bounds means outside every word box, not off the screen; blink needs
a blink column in your fixations (is_blink, blink, blink_before,
blink_after), and without one nothing is flagged.
For saccades, choose which reading types are drawn: hide everything but
regressions, for example. Filtering changes only the figure, never your data.
Place the legends
Figure & canvas → Legends has a row for each legend the figure can draw: Compare (A/B), Saccade types, Fixation colours (a categorical Color by, and the Highlight entries) and the duration Size key. Each row sets where the legend goes, how its items run and its text size:
- Spot: Above, Below, Left or Right of the plot, or Inside one of its four corners. An outside spot makes the figure larger instead of shrinking the plot, so the text stays true to scale. Legends sharing a side line up one after the other.
- Arrangement: Stacked (one item under the other) or Side by side.
- Size: the text size in px; empty uses the figure's own.
On Auto a legend stays where it is drawn by default. These rows only place a
legend: whether it is drawn at all is still its own switch, under its layer. The
size key's circles keep the true marker sizes wherever it goes; its Size
sets the labels. Share links, settings files, saved designs, render --legend
and the API's legend_layout all carry the placement.
Replay and compare
- Animate replays the trial; its ▾ sets the speed.
- Compare adds a second reading, overlaid or side by side. Compare with can take it from another dataset.
- Comparisons lists other trials that match this one on a field you choose: other readings of the same text, or the same participant's other trials.
Side by side, each panel shows its own reading's stimulus image, or none when that reading has no image. An uploaded image stands for the first reading's page, so the second shows it only when it reads the same text on the same screen.
Two readings can be overlaid only when they were shown on the same screen size, within one dataset too; otherwise they are drawn side by side, each on its own screen. Nothing is rescaled to force an overlay.
Compare is also available from Python
(compare_scanpaths) and the
CLI.